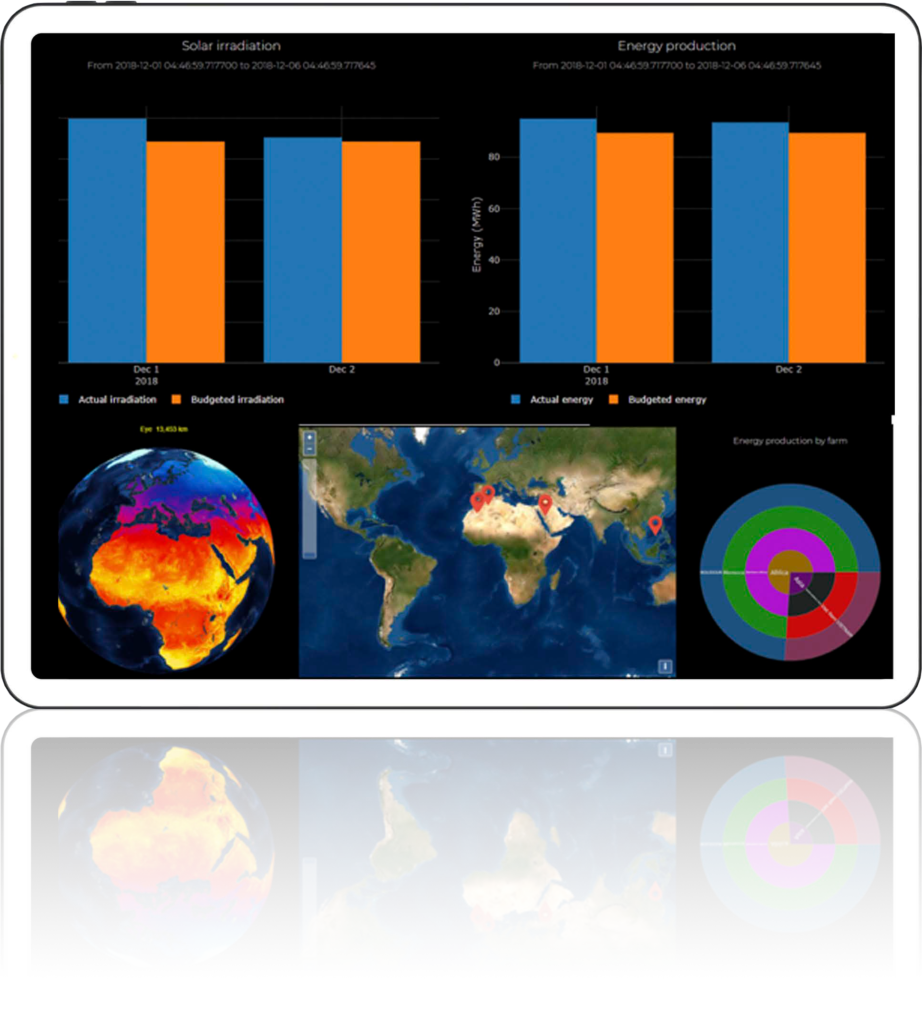
Dashboard
- 30 Map with historical wheater data.
- Several layers will be added.
- Cloudines, dust, etc.
- Map with nearly real time data and plant
- location.
- Distribution of energy by region, plants.
- KPls aggregates.
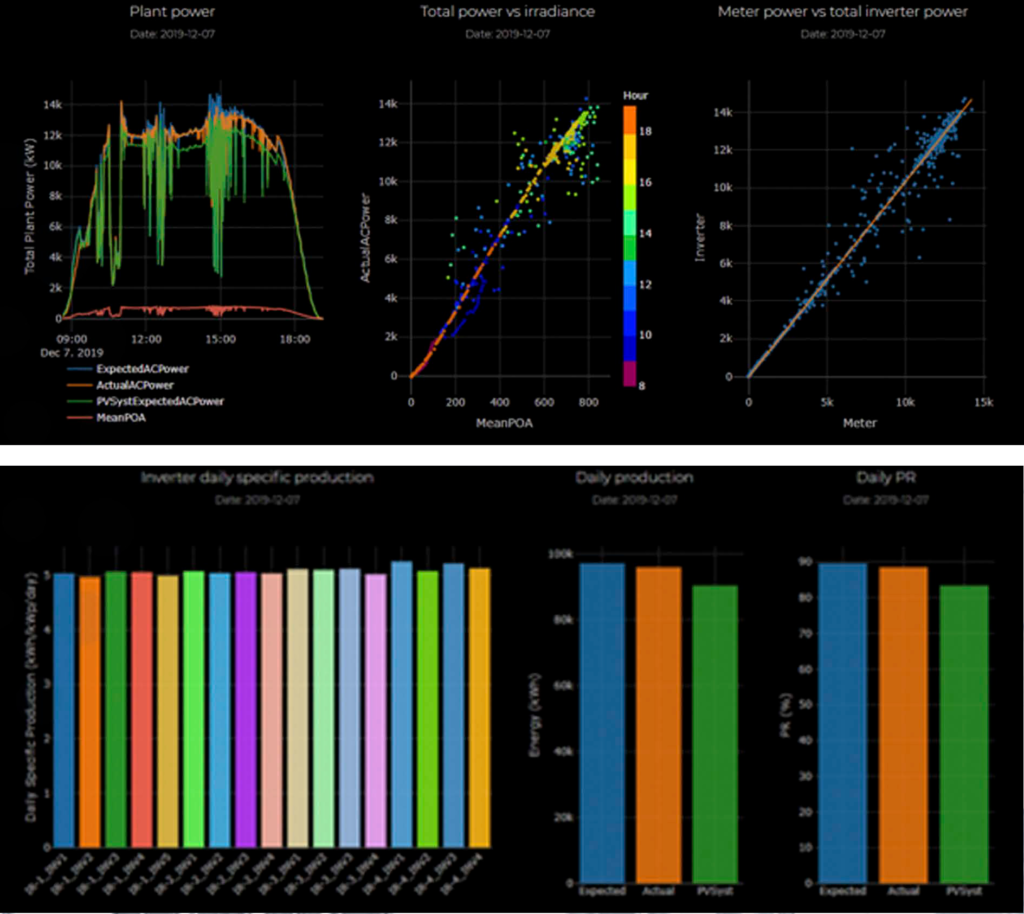
Plant Summary
- Time series expected vs Actual Energy.
- Power vs lrradiance.
- lnverter Power vs Meter Power.
- lnverters Yield.
lnverter Performance
- AII losses per ivnerter. Heatmap.
- Violin graph of all losses.
- 3D Inverter Efficiency.
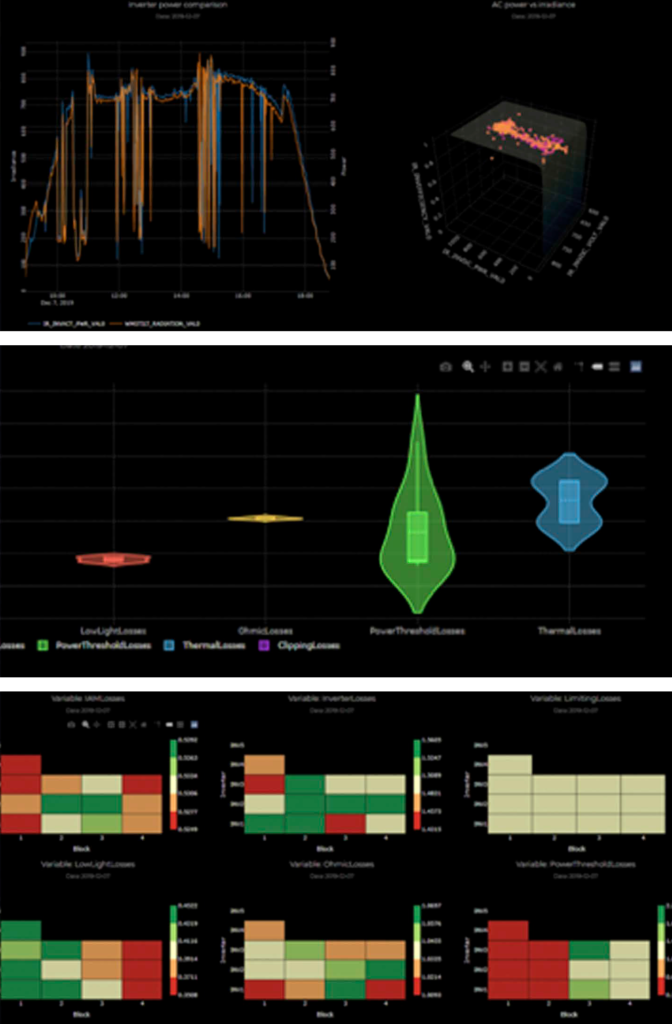
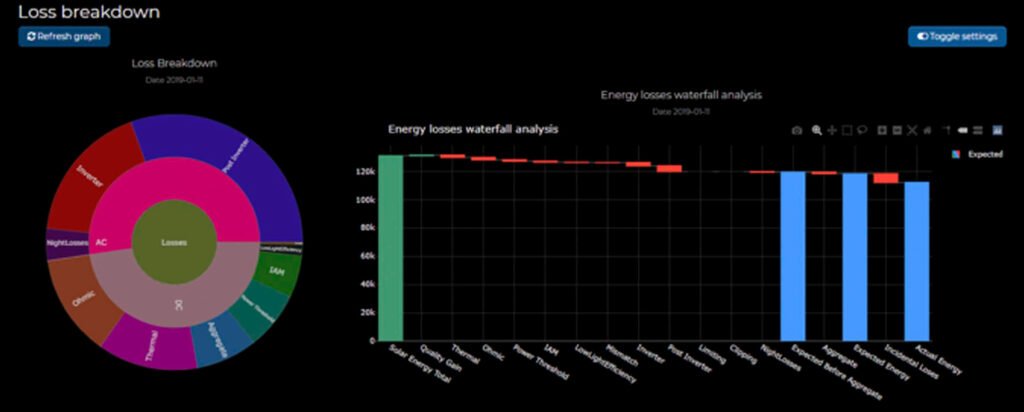
Losses analysis
- All losses breakdown.
- Waterfall analysis
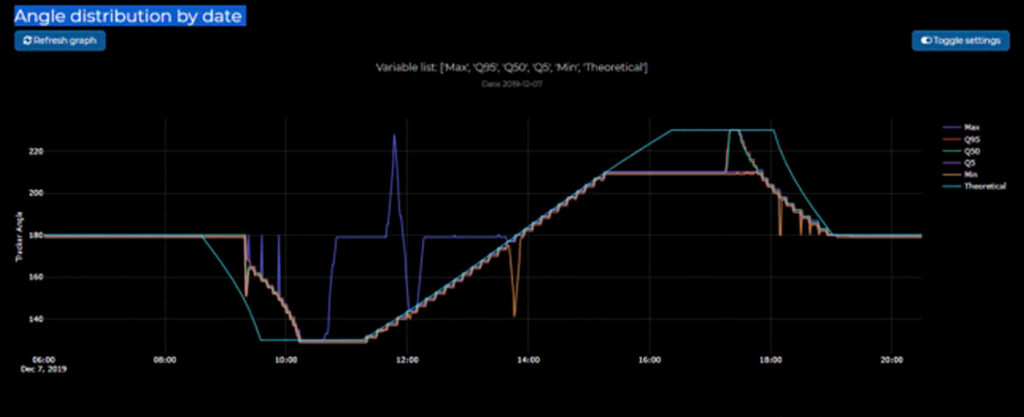
Tracker analysis
Tracker angle trends
By comparing theoretical tracker angle with actual tracker angle, even small transistory deviations can be discovered. These problems usually remain unnoticed for years.
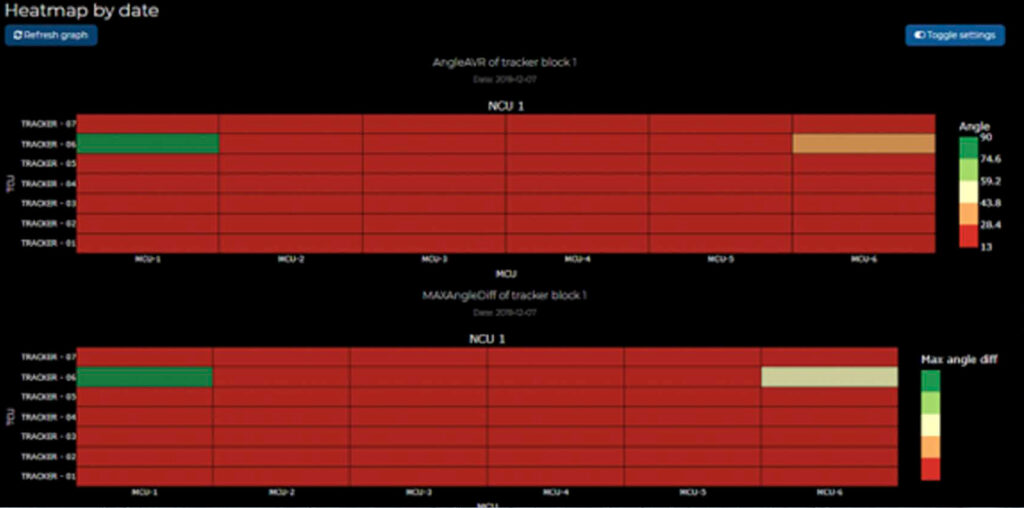
Angle distribution heatmaps
An easy way of noticing bad players, a feature which is vital while managing big plants.
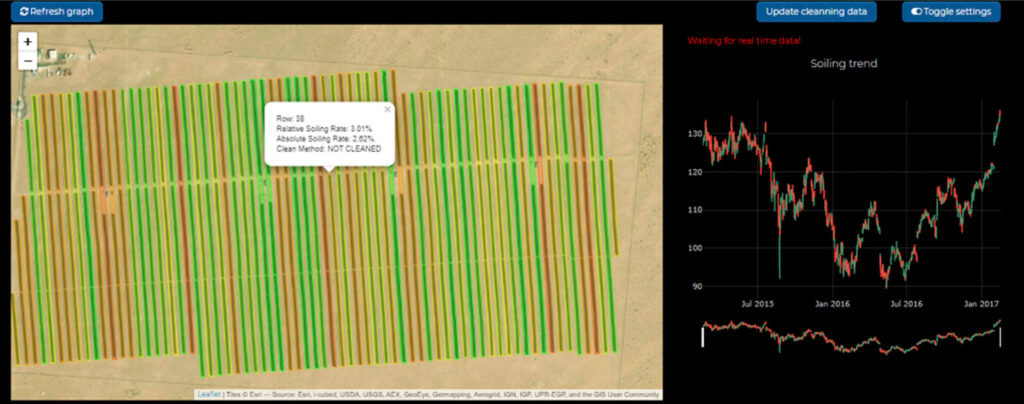
Cleaning Strategy (Almost Ready)
Smart cleaning tool to manage soiling of the plant:
- A map of the plant with the soiling per row
- Both relative and absolute soiling values
- Soiling trend by row
- 1 nterface to enter the cleaning activities data
- Water and fuel management